Supporting Statement Part B Warning Devices for Stopped CMVs 12.03.2025
Supporting Statement Part B Warning Devices for Stopped CMVs 12.03.2025.docx
Study of Warning Devices for Stopped Commercial Motor Vehicles
OMB:
Department of Transportation
Federal Motor Carrier Safety Administration
SUPPORTING STATEMENT PART B
“Study of Warning Devices for Stopped Commercial Motor Vehicles” ICR
INTRODUCTION
This is to request the Office of Management and Budget’s (OMB’s) review and approval of a new Federal Motor Carrier Safety Administration (FMCSA) information collection request (ICR) titled Study of Warning Devices for Stopped Commercial Motor Vehicles.
Part B. Collections of Information Employing Statistical Methods
DESCRIBE POTENTIAL RESPONDENT UNIVERSE AND ANY SAMPLING SELECTION METHOD TO BE USED.
1.1 Respondent universe
The inclusion criteria for this study are:
Must possess a valid U.S. driver’s license.
Must be between 18 and 80 years old.
Must be willing to provide a social security number (SSN).
Must be able to read, write, and speak English fluently.
Must have normal or corrected to normal hearing based on a verbal hearing test.
Must have normal or corrected to normal vision in both eyes. If glasses are worn for driving, must be willing to wear corrected instrumented glasses for capturing eye movements
Must be able to pass a vision test and cannot simply agree not to wear their glasses during the session.
Must be comfortable wearing the instrumented glasses throughout the session (while driving).
Must be able to drive the vehicle without sunglasses or glasses that darken in the sunlight while inside a vehicle.
Must not require assistance to walk out to the vehicle or get in and out of a motor vehicle – no mobility limitations. No leg braces, or ankle/foot in a brace/boot, etc.
Must be able to drive an automatic transmission without assistive devices or special equipment.
Must not have been convicted of an injurious accident (driving violation) in the past 3 years.
Must not have been convicted of more than two driving violations in the past 3 years.
Must drive at least 2 days per week on average.
Cannot have a history of brain damage from stroke, tumor, head injury, recent concussion, or disease or infection of the brain.
Cannot have uncontrolled diabetes (frequent low/high blood sugar levels that they are struggling to keep regulated). Cannot have been recently diagnosed or have been hospitalized for this condition or incurred any changes in their insulin prescription during the past 3 months.
Cannot have current respiratory disorder/disease or disorder/disease requiring oxygen.
Cannot have, on average, more than one migraine or severe headache per month during the past year.
Cannot have any Epileptic seizures or lapses of consciousness within the last 12 months.
Cannot have current problems with inner ear, dizziness, vertigo, or balance problems.
Must not have had any major surgery within the past 6 months (including eye procedures).
Cannot have any current heart conditions that limit your ability to participate in certain activities.
Cannot have any history of neck or back conditions, or injury to those areas.
Cannot currently be taking any substances that may interfere with driving ability (cause drowsiness or impair motor abilities).
According to the U.S. Census Bureau, as of recent estimates, approximately 75% of the U.S. population falls within the 18-80 age range1. Given a total population of about 336 million2, this results in approximately 252.0 million individuals.
Approximately 89% of the U.S. population aged 16 and older has a driver's license3. Applying this percentage to the 224.3 million individuals aged 18-80 gives roughly 186.6 million licensed drivers.
It's difficult to estimate this without specific data, but for this calculation, we might conservatively assume that around 90% of the eligible population would be willing to provide their SSN, resulting in approximately 201.9 million individuals.
Approximately 91% of the U.S. population speaks more than limited English4. Assuming similar fluency among licensed drivers, this results in about 183.7 million individuals.
Conservative estimates of drivers with multiple driving violations in a 3-year period place approximately 15% of drivers as ineligible, based on data from traffic safety reports (i.e., 3.1 million drivers involved in injury- or fatality-related crashes annually5; 20% of drivers annually receive a speeding ticket6). Repeat offender violations and translations to triennial violation rates make accurate determination difficult with available information. The 15% approximation would reduce the pool further to around 156.1 million individuals.
Corrective vision is not expected to be a significant factor, as the eye-tracking glasses will have corrective lenses available for participants with corrected vision who do not wear contacts.
Given these rough estimates and conservative assumptions, the potential respondent universe is approximately 156.1 million individuals in the U.S. who meet all the specified criteria. However, this number could vary based on more specific or updated data. Additionally, the interdependencies among these factors are not fully known, meaning some combinations of criteria may significantly impact the actual number of eligible participants more than others. For instance, individuals not fluent in English may have lower rates of licensure for driving.
1.2 Sampling selection method
We anticipate a mix of convenience, respondent-driven, and snowball sampling to recruit 256 drivers to participate in the full data collection. VTTI has its database of people which will be conveniently available to access. In addition, VTTI has experience utilizing recruitment ads to disseminate participant recruitment information for experimental studies. We also expect to ask research participants to identify potential research participants from acquaintances.
In summary, participant recruitment methods that will be utilized:
VTTI will leverage its database of people who have participated in previous research studies or have expressed interest in possible participation.
The Virginia Tech Transportation Institute (VTTI) will provide recruitment ads to disseminate information about participation in the research study. VTTI may place recruitment ads in newsletters and on social media. The recruitment ads will allow participants to contact VTTI personnel freely.
VTTI will ask research participants to spread the experiment information to their acquaintances, potentially to speed up the recruitment process.
All participants are expected to be recruited from Blacksburg, Virginia, and surrounding areas. Participant recruitment will be based on obtaining a fairly balanced group of participants across sex and age.
Through these methods, interested participants may be contacted by VTTI or may contact VTTI. We anticipate receiving a pool of potential participants. VTTI will select the drivers based on the order of who express interest in study participation through the contact methods above and who meet the study inclusion criteria.
DESCRIBE PROCEDURES FOR COLLECTING INFORMATION, INCLUDING STATISTICAL METHODOLOGY FOR STRATIFICATION AND SAMPLE SELECTION, ESTIMATION PROCEDURES, DEGREE OF ACCURACY NEEDED, AND LESS THAN ANNUAL PERIODIC DATA CYCLES.
2.1 Procedures for collecting information
The study design is a closed test-track study to test whether warning devices meaningfully influence crash-relevant aspects of human performance in the presence of a stopped commercial motor vehicle (CMV), and if so, how and to what extent.
The present study consists of an experiment structured as a 2 × 2 × 2 mixed-model factorial design. This study will include the evaluation of warning devices (present, absent) across two road geometry configurations (straight, curved) and two temporal lighting conditions (day, night). Main dependent variables for the experiment will be the warning device detection distance, detection patterns, and driving behaviors. The final research design is full factorial, including combinations of eight potential conditions. VTTI will recruit 256 individuals to participate in this study and assign participants to one of the eight conditions. Half (128) will participate during the day, and the other half (128) will participate at night. Each participant will encounter four stopped CMVs while driving, each under slightly different conditions. The participants will encounter one stopped CMV per trip on the VTTI research facility―Smart Road (i.e., four Smart Road test trips per participant); see Figure 1. The order of presentation will be “counterbalanced” so that each combination of conditions will be the “first scenario” experienced for 32 out of 256 participants. For example, for 32 participants, the first of four stopped CMVs will be encountered at night on a curved road without warning triangles deployed. Another 32 participants will first encounter the first of four stopped CMVs during the day on a straight road with warning triangles deployed. See Figure 2 for the detailed study design the VTTI team will be conducting.
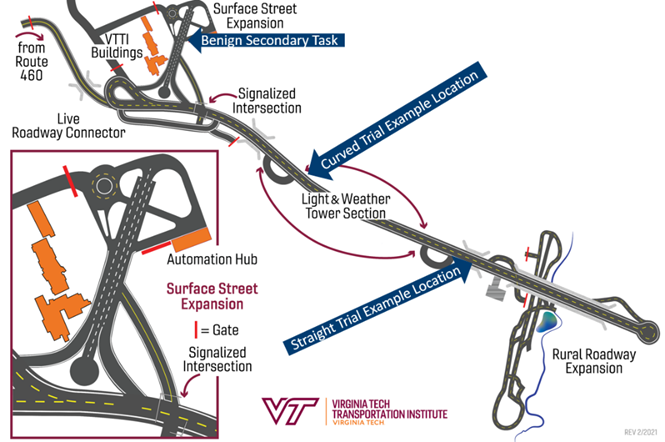
Figure 1 Map of the VTTI Smart Road with labels highlighting experimental locations.
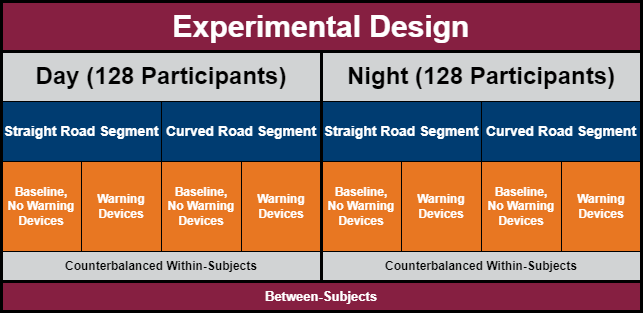
Figure 2 Experimental design with the within- and between-subjects breakdown of conditions.
The experiment is designed to include within- and between-subjects design characteristics. The experiment will be divided between subjects for temporal lighting conditions, while road geometry and warning device conditions will be within subjects. The strength of this approach lies in the increased statistical power (e.g., greater probability of detecting effects, including smaller and more inconsistent effects) of within-subjects designs and the efficiency of data collection, as a larger ratio of the time participants spend in the experiment will result in valuable data. Within-subjects trials will be counterbalanced to control for order of exposure and practice effects, effectively ensuring each experimental condition is seen first by 32 participants.
In addition to the experimental task (i.e., seeing and responding to a stopped CMV), some secondary task activities will be included to obscure the study goal (See Figure 1 for Scenario Map). The participant will be driving a 2012 Ford Taurus instrumented vehicle. The data acquisition system (DAS) in the vehicle will record vehicle speed, GPS position, video inside and outside of the vehicle, as well as eye tracking data. Participants will have an opportunity to acquaint themselves with the Smart Road and research vehicle with a practice lap around the Surface Street and Highway portions of the Smart Road. Next, participants will be brought to the surface street test track to perform a benign secondary task that the participant believes is the primary goal of the study. Stopped CMV critical trials will take place during the participant’s highway (Smart Road) drives. Participants will alternate between the benign secondary driving task on the surface street (n=4) and critical trials on the highway (n=4) with the potential stopped CMV locations and device deployments for either day or night. A dual purpose of the benign secondary tasks on the surface street is to allow time for the research team to set up each critical trial on the highway.
Critical trials will occur on a two-lane highway with a stopped CMV partially in the participant’s lane with the potential of an oncoming passenger vehicle in the opposing lane. The stopped CMV will be parked partially in the travel lane, requiring the participant to steer or brake to pass, while the oncoming confederate vehicle would prevent the participant from steering into the opposing lane without also adjusting the speed of the vehicle. The DAS will collect all driving and visual behaviors necessary to answer the research questions. Following completion of 9 trials (1 practice, 4 benign secondary task trials, and 4 critical trials), participants will exit the Smart Road and return to the participant intake room to complete the post-drive phase and end the data collection.
2.2 Statistical Methodology for Stratification and Sample Selection
Sample selection will be purposive in nature. The research team will recruit participants using the following techniques: VT newsletter ad, news ad, electronic social media posts, phone scripts and email communication templates for contacting potential participants via the VTTI database.
The sample selection method will follow a convenience sampling, respondent-driven sampling and snowball sampling plan. Drivers who respond to the recruitment ads and meet the established inclusion criteria will be selected on a first-come basis. Through the recruitment methods, we anticipate receiving a diverse pool of potential participants that fit the general demographics of the recruitment area. Poststratification by key variables, such as age, sex, or driving experience, will be included in the analysis approach.
2.3 Degree of Accuracy Needed
The experimental design of the present study is a 2×2×2 mixed design with lighting condition as a between-subjects factor (daytime, night time), and road geometry (straight, curve) and presence of warning devices (present, absent) as within-subjects factors. To determine if the predetermined sample size (i.e., a total of 256 participants with 32 participants in one condition) is appropriate, an a-priori power analysis was conducted. The power analysis utilized a previous study that VTTI conducted to evaluate the safety equivalence of lighting beacons versus warning triangles7 (hereafter referred to as the WD surrogate study) as a reference to determine whether the design has sufficient power to detect the desired effect size. The WD surrogate study shares a similar purpose and characteristics with the present study, making it a reasonable source for referencing. In addition, a study by Allen et al. (1973)8 evaluating driver detection of warning triangles in day and night conditions was used as a reference in the power analysis.
The power analysis was conducted using the free statistical computing tool R with the Superpower package. The Superpower package utilizes a simulation approach for power analysis (See Lakens et al., 2021 for a comprehensive introduction of Superpower9). The power analysis assumed a type I error rate of α = 0.05 and type II error rate of β = 0.2 (i.e., power = 0.8). The averages of triangle detection distance by the participating drivers in the WD surrogate study were 429.34m (SD = 70.00m) for straight road daytime driving, 312.02m (SD = 106.05m) for curved road daytime driving, 481.31 m (SD = 32.13m) for straight road night time driving, and 336.32m (SD = 101.141m) for curved road night time driving, summarized in Table 1. The WD surrogate study only collected data with warning devices present and did not collect data on detection distance without any sort of warning device. The WD surrogate study provides the data needed to calculate the effect sizes expected for the present study. An early study by Allen et al. (1973) mentioned that the presence of a warning triangle or not in the day time did not affect drivers’ detection distance, indicating an expectation of a minimum effect size for the effect of presence of warning devices during daytime. On the other hand, one can expect the presence of warning devices to be more effective during night time. Note that the study by Allen et al. was conducted with a relatively small sample size with missing data.
Table 1 Descriptive statistics from the WD surrogate study
Road Geometry |
Daytime |
Night time |
||
Mean (m) |
SD (m) |
Mean (m) |
SD (m) |
|
Straight |
429.32 |
79.00 |
481.31 |
32.13 |
Curve |
312.02 |
106.05 |
336.32 |
101.41 |
Given the findings from Allen et al. (1973) and the WD surrogate study, it was assumed that the difference in detection distance with and without a warning triangle present would be best estimated by a small effect size. A typical small effect size commonly used in power analysis is Cohen’s d = 0.2. Assuming d = 0.2 and WD surrogate study daytime warning triangle detection distances (429.32 for straight roads and 312.02 for curved roads), the estimated average daytime detection distance when warning triangles are absent is 412.86m for straight roads and 295.50m for curved roads The WD surrogate study detection distance values for warning triangles present, estimated detection distance values for warning triangles absent, type I error rate, and type II error rate were used for simulation input. Altogether, the information was analyzed by the function provided in the Superpower package.
The simulation result showed that with 32 participants in each condition, the study will have higher than desired power of 80% to detect the expected effect size for the two within-subject factors, i.e., road geometry and the presence of warning triangles (See Figure 3). As for the between-subject factor, it is expected that the sample size in each condition would need a slightly larger number (46). This is expected as the expected effect size was smaller in the simulation. Further sensitivity power analysis of the temporal lighting condition shows that with 80% of power, the study will find significant effect if the Cohen’s f is greater than 0.48, see Figure 4. Note that the purpose of the study is to find a practical effect if there’s one not to dive into the smallest possible statistically significant effect, and the sensitivity power analysis provides a plausible range of effect sizes at what power level. Finally, considering the total burden hours added to the respondent, choosing 32 participants instead of 46, a total of 274.48 burden hours could be saved. See Table 2 for the comparison.
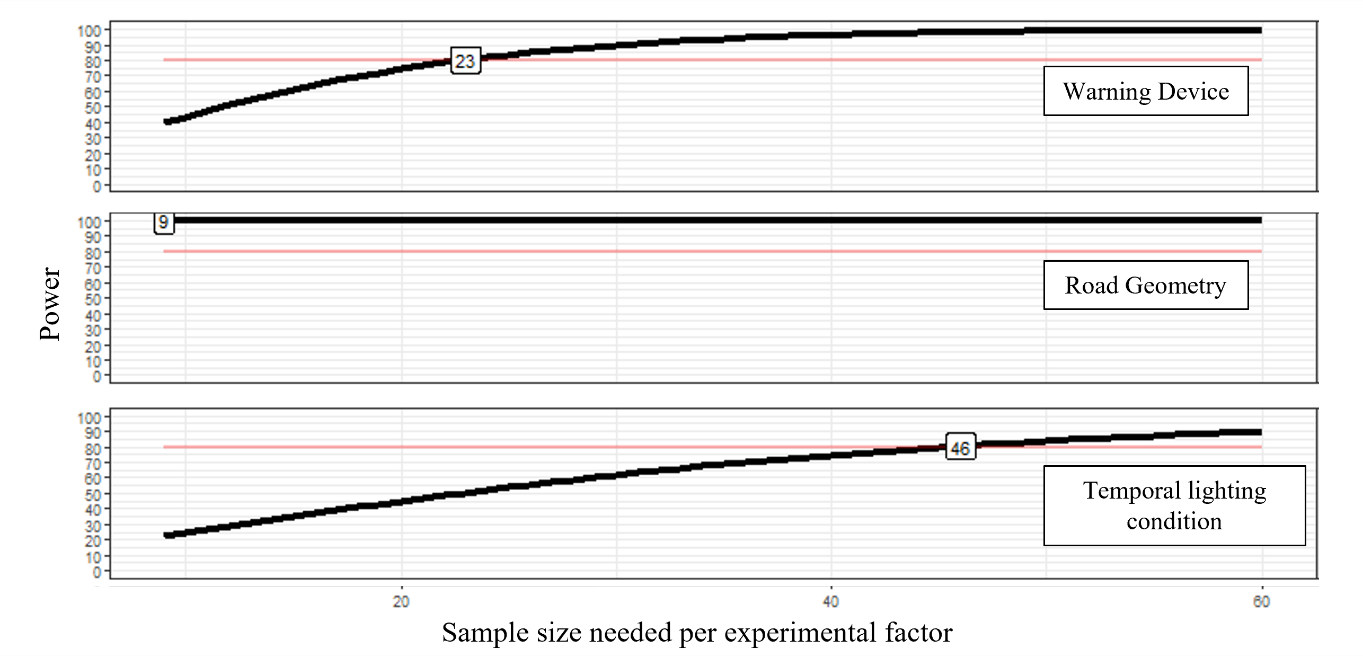
Figure 3 Power versus sample size for the presence of warning device, road geometry and temporal lighting condition. Numbers in the squares indicate the smallest sample size to achieve the desired power (80% in the present study).
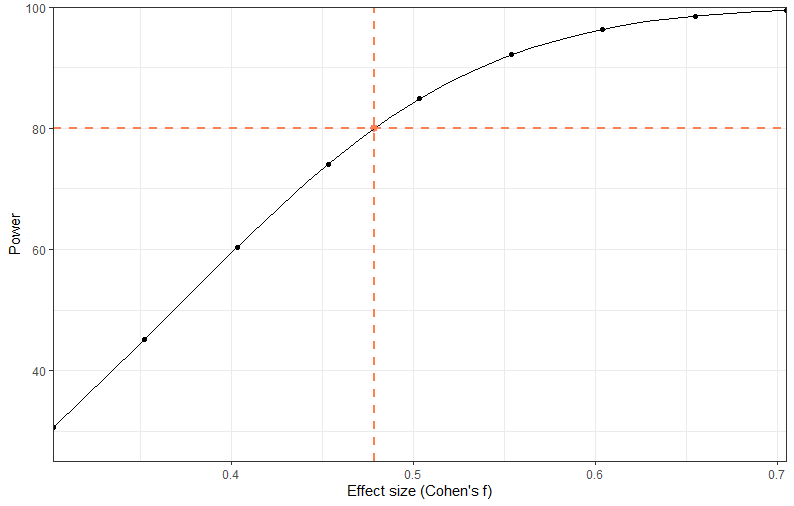
Figure 4 Plot of temporal lighting condition effect size against desired power when n = 32 per condition and alpha = 0.05.
Table 2 Burden hour comparison between 32 and 46 respondents per experimental condition
Task |
Burden per response (minutes) |
32 per condition |
46 per condition |
||
Total respondents |
Total Burden Hours |
Total respondents |
Total Burden Hours |
||
Initial Recruitment |
11 |
357 |
65.45 |
500 |
91.67 |
Consent Form |
13 |
256 |
55.47 |
368 |
79.73 |
W-9 form |
4 |
256 |
17.07 |
368 |
24.53 |
Hearing Test |
1 |
256 |
4.27 |
368 |
6.13 |
Vision Test |
3 |
256 |
12.80 |
368 |
18.40 |
Experimental Questionnaires |
9 |
256 |
38.40 |
368 |
55.20 |
Driving Tasks |
65 |
256 |
277.33 |
368 |
398.67 |
Study Acknowledgement |
2 |
256 |
8.53 |
368 |
12.27 |
Post-Experiment Survey |
5 |
256 |
21.33 |
368 |
30.67 |
Issuance of Compensation |
1 |
256 |
4.27 |
368 |
6.13 |
Summary |
144 |
504.92 (hours) |
723.4 (hours) |
||
To estimate the precision of a measure, the level of accuracy with given sample size can be calculated by:

where N is the sample size, z is the critical value related to the desired confidence interval, sd is the standard deviation of a measure in the population, and desired error is the width of the confidence interval within which the mean should fall. With N = 256, z = 1.96 (using 95% confidence interval), and pooled standard deviation of 82.3 from the WD surrogate study, the expected error is roughly 10 meters of the average warning device detection distance, which is the primary dependent variable of the present study.
In addition to the estimated accuracy, the study set type I error and type II error to 5% and 20%. The study is expected to have 80% power to detect significant effects if the effects exist and to have a reasonably small false-positive rate if there are no effects of the factors of interest on warning device detection distance.
2.4 Analysis Methodology
The data analysis approach comprises several stages, and the research team will apply the most appropriate statistical methods to answer research questions, i.e., understanding driver’s visual and manual behaviors with and without warning devices in different combinations of experimental factors. First, data will be examined for outliers and cleaned. Second, a series of mixed-model 2 × 2 × 2 analyses of variance will be used to analyze mean reaction and detection distance data. Third, a series of t-tests, for paired and independent samples, with Bonferroni corrections, will be utilized to examine the nature of any differences found. Fourth, correlations will be made between demographics, risk acceptance, and the primary outcome measures (reaction and detection time). Finally, the correlation matrices will inform regression analyses to determine if risk acceptance or other collected demographic characteristics predict warning device and/or vehicle detection or reaction time. Further analyses will be explored using a series of mixed-effect general linear models to explore the impact of and interaction between study conditions, order of exposure, driver demographic features, and survey responses on the outcome variables. There is also a potential that participants will not react to the presence of warning triangles at all, a situation where a generalized linear model could be an applicable tool to predict a binary detection outcome variable.
2.5 Study Design
The study was designed to best address the established research questions. The design maximizes data collection in experimental conditions of particular interest within the time constraints of a driving session. The study will be a closed test-track study to test whether warning devices meaningfully influence crash-relevant aspects of human performance in the presence of a PDCMV (parked/disabled commercial motor vehicle), and if so, how and to what extent. The order of presentation will be “counterbalanced” so that each combination of conditions will be the “first scenario” experienced by 32 out of 256 participants. For example, for 32 participants, the first of four PDCMVs will be encountered on a curved road at night without warning triangles deployed. Another 32 participants will first encounter the first of four PDCMVs on a straight road with warning triangles deployed during the day.
This experiment is structured as a 2 × 2 × 2 mixed-model factorial design. This study will include the evaluation of warning devices (present, absent) across two road geometry configurations (straight, curved) and two temporal lighting conditions (day, night). The final research design is full factorial, including eight potential conditions combinations for 256 participants. The warning device configuration will follow 49 CFR §392.22 guidelines.
DESCRIBE METHODS TO MAXIMIZE RESPONSE RATE AND TO DEAL WITH THE ISSUES OF NON-RESPONSE.
3.1 Methods to Maximize Response Rate
Participants will be recruited from VTTI’s database of drivers who indicated interest in future studies and are located within a day’s drive of VTTI headquarters in Blacksburg, Virginia. The database includes drivers who have previously completed a study with VTTI and therefore have shown a commitment to study participation in past research. Considering the proximity of accessible, interested participants, VTTI expects to find drivers with a desire and ability to participate and complete the study. Drivers selected for the study will be reminded of the study participation date through a phone call and email the day before their scheduled participation. The phone call and email will include VTTI contact information, with multiple VTTI contact options.
The participants will be told their participation is voluntary, that they will have the opportunity to have any questions answered prior to deciding to participate and, and that they can terminate their participation at any point without prejudice or harm to them in any way. This should increase the likelihood of their willingness to participate in the study.
The research team will offer incentives to promote interest in participating in the study and to improve retention over the study period. The proposed incentive of a pro-rated monetary compensation for participants’ time has been reviewed and approved by the Virginia Tech Institutional Review Board. Incentives will be distributed via a rechargeable debit card, which the participant will receive at the end of the study.
3.2 Methods to Deal with Issues of Non-Response
During data collection, there will be multiple opportunities to correct missing data to lessen instances of non-response. For example, driver questionnaires filled out at the study start will be reviewed by a researcher during the study. If the questionnaire is not fully complete, participants can be asked at study completion if they would like to provide a response to missed questions or keep responses as originally submitted. In addition, drivers will be given time between study tasks, providing multiple opportunities to provide answers to study questions scheduled for the time window. Researchers will address any follow-up questions participants may have regarding the study session.
There will be several additional strategies to deal with non-response in the data. These include:
1) Generalize to the respondents only. This strategy avoids making erroneous inferences about the larger population.
2) Compare data in hand on respondents and nonrespondents. If data (e.g., sex, age, race) is available, the composition of respondents will be compared with that of nonrespondents to see if there are any differences. The presence of differences indicates response bias and that caution is necessary in making inferences.
DESCRIBE TESTS OF PROCEDURES OR METHODS TO BE UNDERTAKEN.
All
data collection methods proposed in the current study have been
assessed in prior VTTI studies. The study will include participants
in accordance with the Virginia Tech Institutional Review Board (IRB)
#24-18610.
The study will include an informal pilot test to ensure that data
collection procedures are established and validated prior to data
collection kickoff, and the data collection model will be tested by
the VTTI study team. Participants in the pilot test will complete the
full test following the protocol approved by VT IRB. Pilot test data
will be summarized using graphs, plots, tables, and summary
statistics. Data collected in individual questionnaires and driving
sessions will be assessed. The pilot test data exploration will be
used to identify questionnaire items that need further clarification
in the full test and driving test protocol aspects that would benefit
from revision.
PROVIDE NAME AND TELEPHONE NUMBER OF INDIVIDUALS WHO WERE CONSULTED ON STATISTICAL ASPECTS OF THE INFORMATION COLLECTION AND WHO WILL ACTUALLY COLLECT AND/OR ANALYZE THE INFORMATION.
Project Lead for this ICR:
Andrew Miller
Group Leader, Fleet Focus and Industry Applications
Virginia Tech Transportation Institute
3500 Transportation Research Plaza
Blacksburg, VA 24061
(540) 231-1095
Statistician:
Susan Soccolich
Senior Research Associate, Division of Feight, Transit, and Heavy Vehicle Safety
Virginia Tech Transportation Institute
3500 Transportation Research Plaza
Blacksburg, VA 24061
(540) 231-1032
Document Author:
Kuan-Ting Chen
Research Associate, Division of Feight, Transit, and Heavy Vehicle Safety
Virginia Tech Transportation Institute
3500 Transportation Research Plaza
Blacksburg, VA 24061
1 U.S. Census Bureau. (2023). United States population by age and sex. Retrieved from https://www.census.gov/popclock/data_tables.php?component=pyramid
2 U.S. Census Bureau. (n.d.). U.S. and world population clock. Retrieved from https://www.census.gov/popclock/
3 ConsumerAffairs. (n.d.). Number of drivers in the U.S. Retrieved from https://www.consumeraffairs.com/automotive/number-of-drivers-in-us.html
4 Slator. (2024, July 23). Number of non-English-speaking households continues to rise in the United States. Slator. https://slator.com/number-non-english-speaking-households-continues-to-rise-united-states/#:~:text=The%20data%20released%20by%20the,identified%20as%20having%20limited%20English
5 National Safety Council. (n.d.). Motor vehicle overview. National Safety Council. Retrieved July 24, 2024, from https://injuryfacts.nsc.org/motor-vehicle/overview/introduction/
6 Driver Start. (n.d.). The most common traffic tickets. Driver Start. Retrieved July 24, 2024, from https://driver-start.com/blog/the_most_common_traffic_tickets/
7 Mabry, E., Soccolich, S., Meissner, K., Radlbeck, J., and Schaudt, A. (2022). Stopped Automated Commercial Motor Vehicle Warning Device Surrogates (FMCSA-230112-004).
8 Allen, M., Miller S., and Short, J. (1973). The Effect of Flares and Triangular Distress Signals on Highway Traffic. Optometry and Vision Science, 50(4), 305-315.
9 Lakens, D., & Caldwell, A. R. (2021). Simulation-based power analysis for factorial analysis of variance designs. Advances in Methods and Practices in Psychological Science, 4(1), 2515245920951503.
10 Virginia Tech Institutional Review Board Protocol No. 24-186.
| File Type | application/vnd.openxmlformats-officedocument.wordprocessingml.document |
| File Title | SUPPORTING STATEMENT |
| Author | AKENNEDY |
| File Modified | 0000-00-00 |
| File Created | 2026-01-01 |
© 2026 OMB.report | Privacy Policy